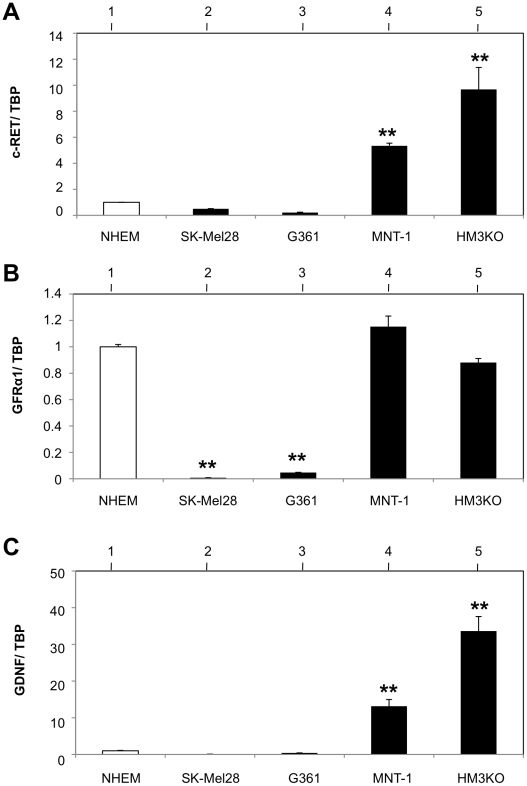
Figure 4. Levels of c-RET, GFRa1 and GDNF transcripts expression in primary-cultured normal human epithelial melanocytes (NHEM) and human malignant melanoma cell lines.
(A, B, C) Levels of c-RET (A), GFRa1 (B) and GDNF (C) transcripts expression in NHEM (lane 1) and 4 kinds of malignant melanoma cell lines (lanes 2–5; SK-Mel28, G361, MNT-1 and HM3KO). The transcript levels measured by real-time PCR were adjusted by TATA-box-binding protein (TBP) transcript levels. Differences in expression levels of c-Ret (A), Gfra1 (B) and Gdnf (C) between NHEM (lane 1; open bar) and malignant melanoma cell lines (lanes 2–5; closed bars) were statistically analyzed by the Kruskal-Wallis test. **, Significantly different (P<0.01) from the control.

