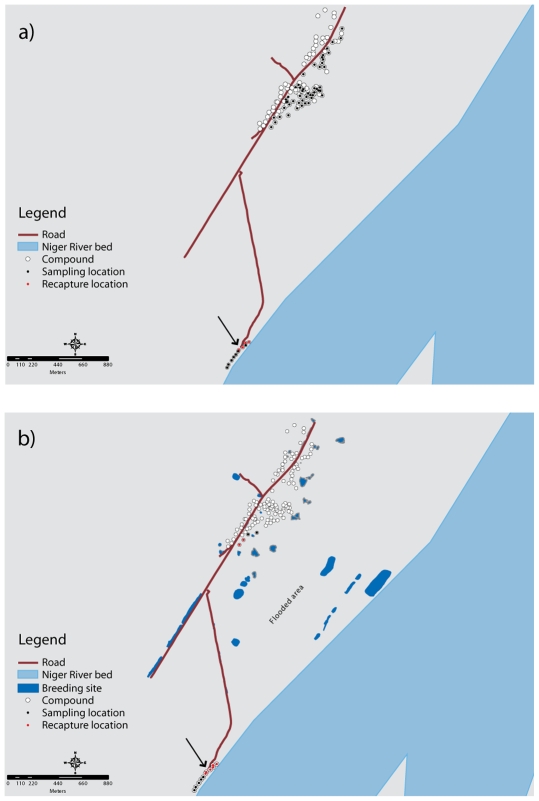
Figure 1. Sampling and recapture locations in Fourda and Kenieroba with breeding sites.
Maps show Fourda (to the South) and Kenieroba (North) in March (a) and July (b). The arrow indicates the marked mosquito release site. Note that the compounds in the northern half of Fourda had much higher numbers of mosquitoes overall, which correlated with higher numbers of recaptures (results not shown). See text for details on sampling regime.

