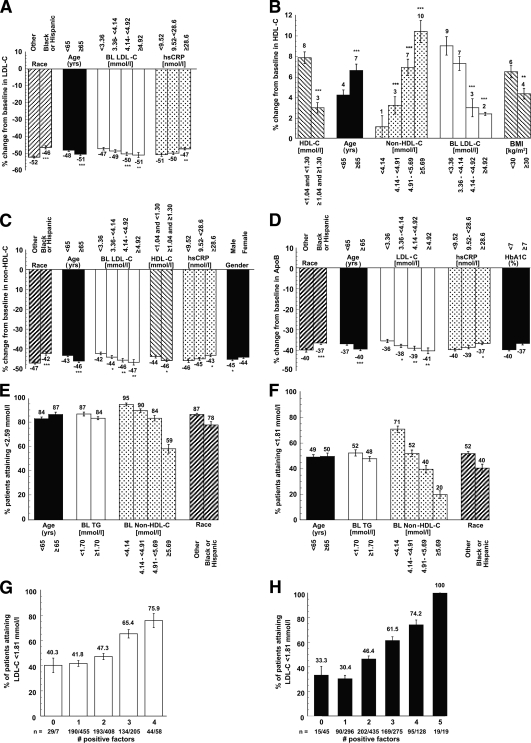
Figure 1.
Multivariable association of categorical factors with the percent change from baseline in LDL cholesterol (LDL-C) (A), HDL cholesterol (HDL-C) (B), non–HDL cholesterol (C), and apolipoprotein B (D). P values (*P < 0.05, **P < 0.01, ***P < 0.001) in A–D correspond to the significance of marked (*) category compared with lowest category for the variable. Association (logistic regression) of categorical factors with the attainment of LDL cholesterol <2.59 mmol/l (<100 mg/dl) (E) and <1.81 mmol/l (<70 mg/dl) (F) is shown. (Note: When non-HDL cholesterol was removed from the multivariable model, baseline LDL cholesterol was a significant factor for attainment of these LDL cholesterol levels, presumably because of the high correlation [r = 0.90] of baseline non-HDL cholesterol with baseline LDL cholesterol levels.) G and H: Proportion of patients who attained LDL cholesterol <1.81 mmol/l (<70 mg/dl) by the number of positive predictive factors in the multivariate model. The four baseline factors associated with LDL cholesterol <1.81 mmol/l, i.e., age ≥65 years, baseline triglycerides <1.70 mmol/l (<150 mg/dl), baseline non-HDL cholesterol <4.14 mmol/l (160 mg/dl), and race/ethnicity other than black or Hispanic, are shown in G. The four baseline factors additionally with ezetimibe/simvastatin (vs. atorvastatin) treatment are shown in H. n = the number of patients with the indicated number of positive factors in the category of all patients assessed for that number. To convert mmol/l to mg/dl, divide by 0.0259. BL, baseline. TG, triglyceride.

