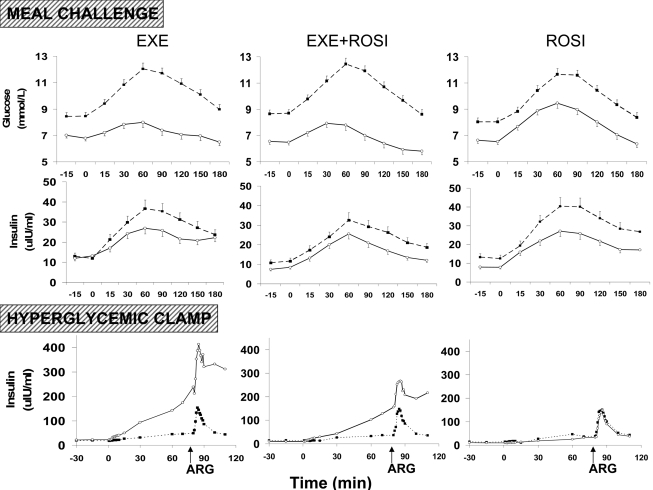
Figure 1.
Glucose and insulin concentrations during the meal challenge test and insulin concentrations during the hyperglycemic clamp before (■, broken line) and after (○, solid line) treatment with EXE, EXE+ROSI, or ROSI. Arrows indicate time of arginine stimulation (ARG) during the hyperglycemic clamp. Data are presented as LS means ± SE for the meal challenge test and LS means for the hyperglycemic clamp.

