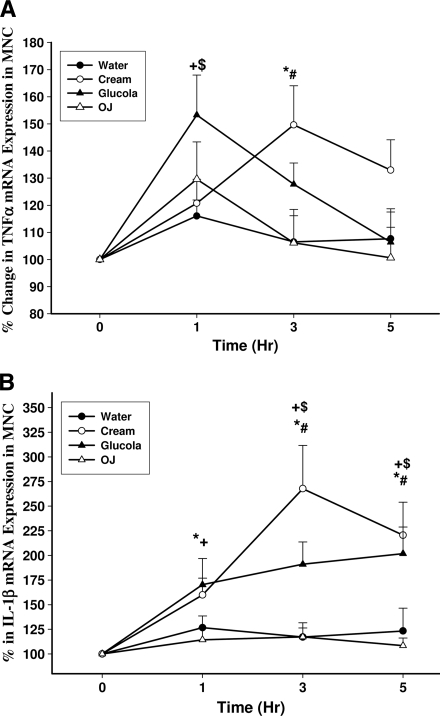
Figure 2.
Change in TNF-α (A) and IL-1β (B) mRNA expression in MNCs from normal subjects after a 300-calorie drink of cream (○), glucose (▴), orange juice (OJ, ▵), or water (●). Data are means ± SEM. * and +, P < 0.05 with RMANOVA comparing changes in relation to baseline after cream and glucose challenges; # and $, P < 0.05 with two-way RMANOVA for comparisons of cream and glucose changes, respectively, to water (n = 12).

