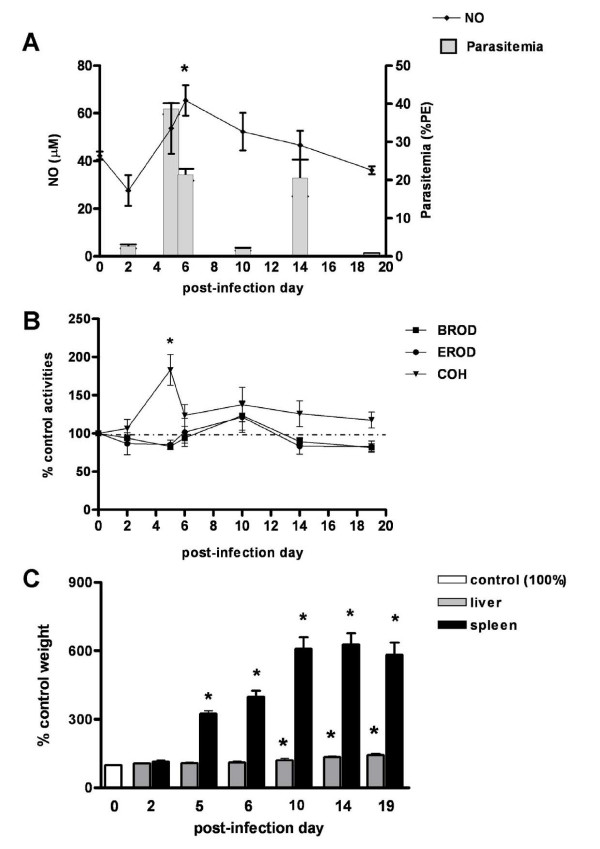
Figure 4.
Effects of P. c. chabaudi infection on CYP activities, NO production and liver weights in DBA-2 mice. Time course of changes of liver CYP activities (CYP1a: EROD, 2b: BROD, 2a5: COH), NO serum levels, and liver and spleen weights in DBA-2 mice infected with P.chabaudi chabaudi. Panel A shows NO serum levels (μM) and parasitaemia rates (%PE). Results in panels B (enzyme activities) and C (liver and spleen weights) are shown as % of mean values for non-infected controls (day 0 = 100) and comparisons were made by ANOVA and Dunnett's post-hoc test. In panels B and C statistical evaluation was made with untransformed data. Differences (P < 0.05) from non-infected control group (day 0) are indicated by an asterisk (*) superscript. Panels B and C control values (100%) are as follows (mean ± S.E.M.): EROD = 130.8 ± 6.7 pmol resorufin/mg protein/min; BROD = 73.7 ± 3.1 pmol resorufin/mg protein/min; COH = 149.4 ± 8.0 pmol umbelliferone/mg protein/min; liver wt = 1.08 ± 0.01 g; spleen wt = 0.11 ± 0.005 g. Control NO = 42.25 ± 1.7 μM (Panel A). Numbers of mice used (N) are as follows: PID0 = 8; PID2 = 8; PID5 = 8; PID6 = 8; PID10 = 8, PID14 = 8; PID19 = 8.

