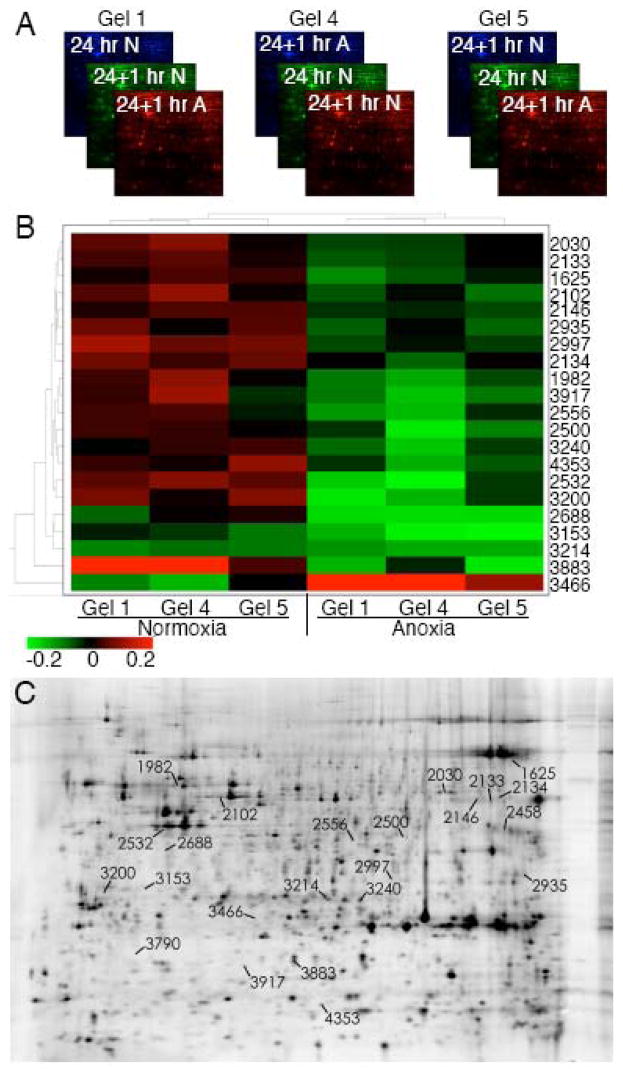
Fig. 2.
2D-DIGE analysis of proteomic changes induced by acute anoxia using an internal standard. (A) Schematic of experimental design in which three 2D gels were run with lysates from 24 hpf embryos using the 24 hpf, normoxic sample as the internal standard (Cy2, Cy3, Cy3 in gels 1, 4, and 5 respectively), and comparing 24 hpf + 1 h normoxia (Cy3, Cy5, Cy2) with 24 hpf + 1 h anoxia (Cy5, Cy2, Cy5). (B) Heat map analysis of statistically significant (p<0.05) proteomic changes after 1 h of anoxia. The color in each panel represents the relative change compared to the internal standard (24 hpf, normoxic) in each individual gel. (C) Image of Gel 4 indicating the location of the spots comprising the heat map.

