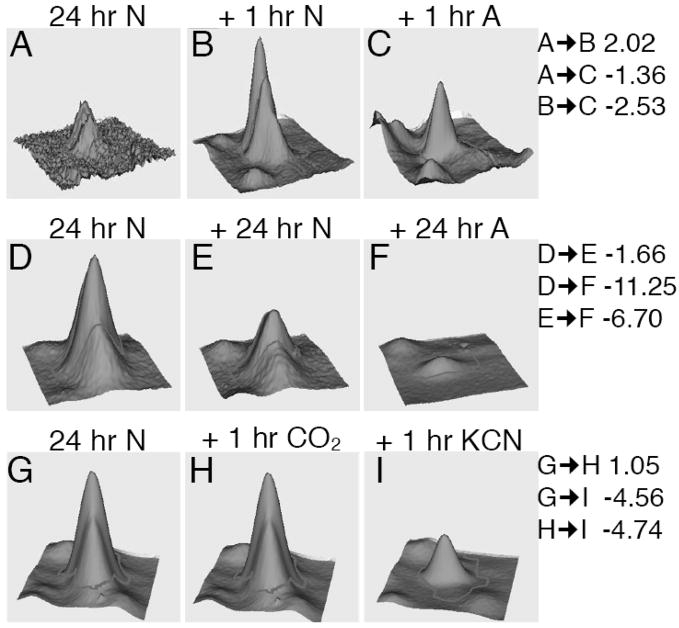
Fig. 3.
Analysis of cofilin changes in acute and prolonged anoxia, and in CO2 and KCN. (A–C) 3D quantitative representation of a spot determined to represent muscle cofilin 2 at 24 hpf, 24 + 1 h normoxia and 24 + 1 h anoxia. (D–F) Cofilin abundance in the same spot at 24 hpf, 24 + 24 h normoxia and 24 +24 h anoxia. (G–I) Cofilin abundance in 24 hpf embryos compared to 24 + 1 h in 5% CO2 or 1 h in 500 μM KCN. Fold changes between each sample are indicated on the right.

