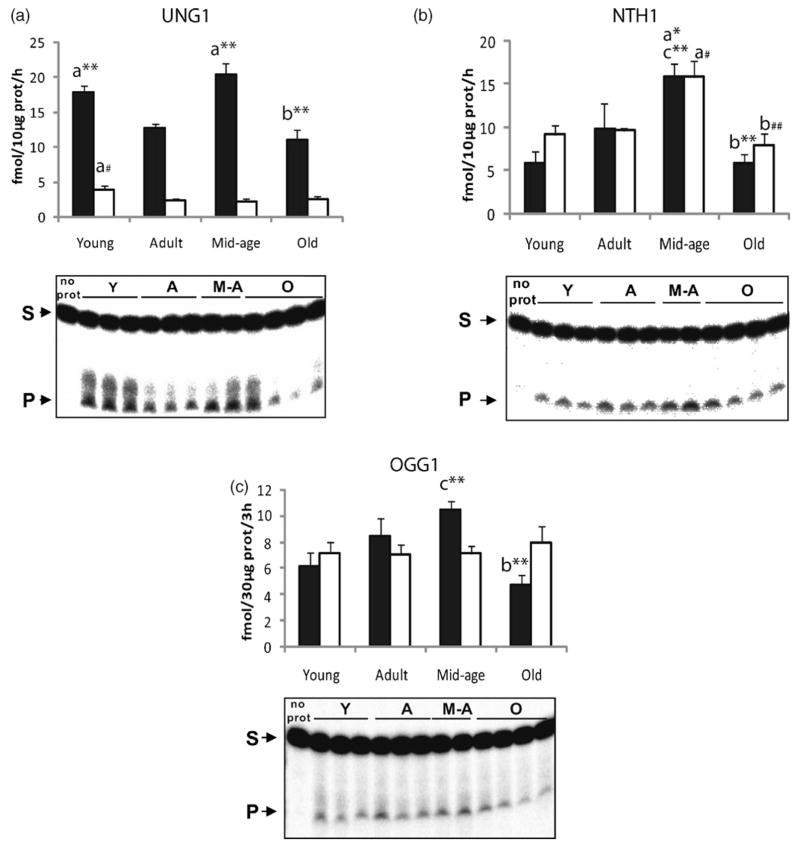
Fig. 2.
Changes in DNA glycosylase activities in mitochondria from cortex and hippocampus with aging. Top panels show quantification of DNA glycosylase activities and bottom panels show representative gels from cortical mitochondria. Incision activities were calculated from the amount of radioactivity in the products relative to the total radioactivity in the lane. Each lane in the gels represents one animal. Values presented are means ± S.E.M. of triplicate measurements from three to five mitochondrial preparations and are expressed as fmol per hour per 10 μg of mitochondrial protein for UNG1 and NTH1 and fmol per 3 h per 30 μg of mitochondrial protein for OGG1 activity. Filled bars represent cortical mitochondrial activities; Open bars represent hippocampal mitochondrial activities. (A) UNG1 activity; (B) NTH1 activity; (C) OGG1 activity. (a) Indicates significant difference versus adult group; (b) indicates significant difference versus middle-aged group; (c) indicates significant difference versus young group. Significant changes in cortical mitochondria: *p ≤ 0.06; **p ≤ 0.01; ***p ≤ 0.001; significant changes in hippocampal mitochondria: #p ≤ 0.06; ##p ≤ 0.01.

