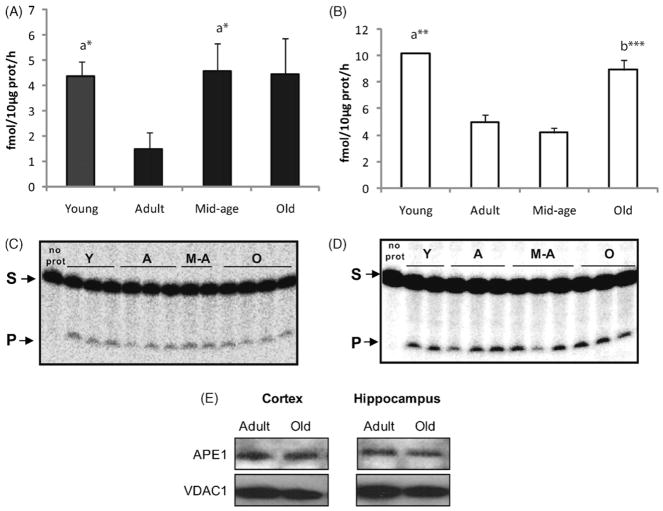
Fig. 5.
MtAPE activity in cortical and hippocampal mitochondria with aging. Quantification of mtAPE activity in cortical (A) and hippocampal (B) mitochondria. Values presented are means ± S.E.M. of triplicate measurements from three to four mitochondrial preparations and are expressed as fmol per hour per 10 μg of mitochondrial protein. (C and D) Representative gels of AP incision in cortical and hippocampal mitochondria respectively. Each lane in the gels represents one animal. (E) Western blot analyses of APE in cortical and hippocampal mitochondria from adult and old groups. Representative blot image is shown. (a) Denotes significant difference versus adult group; (b) indicates significant difference versus middle-aged group; *p ≤ 0.06; **p ≤ 0.01; ***p ≤ 0.001.

