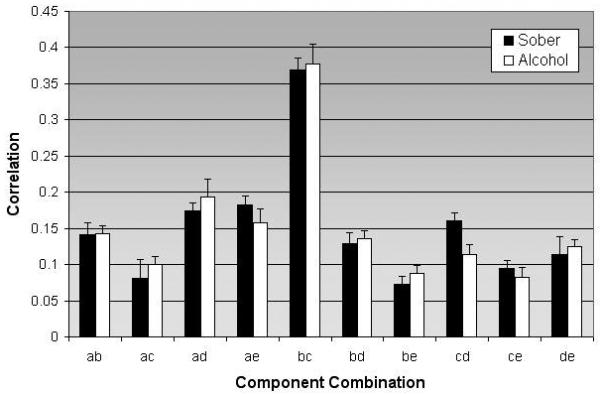
Fig. 2.

Correlation of circuit combinations for participants during sober and alcohol condition X-axis represents the 10 possible combinations, while the y-axis represents the degree of correlation for the particular combination (along with the standard error of mean). All circuit combinations were significant (p < 0.05)
