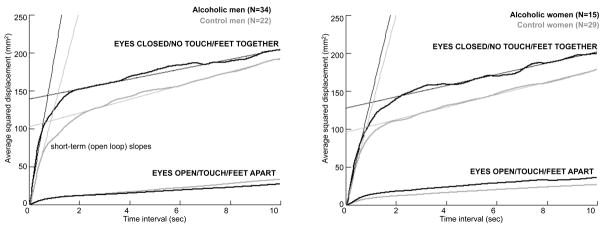
Figure 2.
Group averages of the average squared displacement of pairs of points over time for the alcoholic and control men (left panel) and alcoholic and control women (right panel). The top pair of curves in each panel displays the group averages of the alcoholics (black lines) and controls (gray lines) in the no stabilizing aid condition; the bottom pairs display the group averages of each group with all three stabilizing aids. The fast rising arm of the curves reflects the short-term, open-loop component of the sway diffusion, and the flatter sloped curve reflects the long-term, closed-loop component. Also noted are the critical points, which mark the change over from the open to closed loop components.

