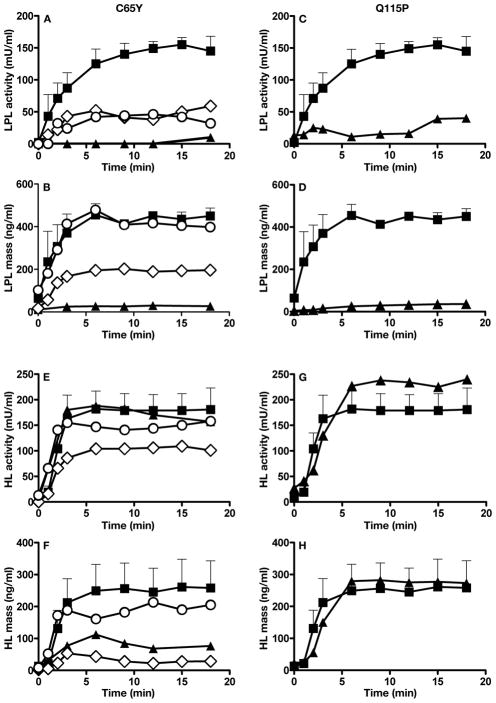
Figure 6. The appearance of LPL and HL in the plasma after heparin.
A–B. LPL in the plasma after an intravenous bolus of heparin in the subject homozygous for a C65Y mutation in GPIHBP1, his heterozygous parents, and four normolipidemic controls. LPL activity (A) and mass (B) in postheparin plasma were measured during an 18-min sampling period after an intravenous injection of heparin (50 U/kg body weight). Proband (▲); father (○) mother (◇); and controls (■). For the controls, data are expressed as mean ± SEM.
C–D. LPL in the plasma after an intravenous bolus of heparin in the subject homozygous for a Q115P mutation in GPIHBP1 and normolipidemic controls. LPL activity (C) and mass (D) in postheparin plasma was measured during an 18-min sampling period after an intravenous injection of heparin (50 U/kg body weight). Proband (▲); and controls (■). For the controls (n = 4), data are expressed as mean ± SEM.
E–F. HL in the plasma after an intravenous bolus of heparin in the subject homozygous for a C65Y mutation in GPIHBP1, his heterozygous parents, and four normolipidemic controls. HL activity (E) and mass (F) in postheparin plasma were measured during an 18-min sampling period after an intravenous injection of heparin (50 U/kg body weight). Proband (▲); father (○); mother (◇); and controls (■). For the controls, data are expressed as mean ± SEM.
G–H. HL in the plasma after an intravenous bolus of heparin in the subject homozygous for a Q115P mutation in GPIHBP1, and normolipidemic controls. HL activity (G) and mass (H) in postheparin plasma was measured during an 18-min sampling period after an intravenous injection of heparin (50 U/kg body weight). Proband (▲); and controls (■). For the (n = 4), data are expressed as mean ± SEM.

