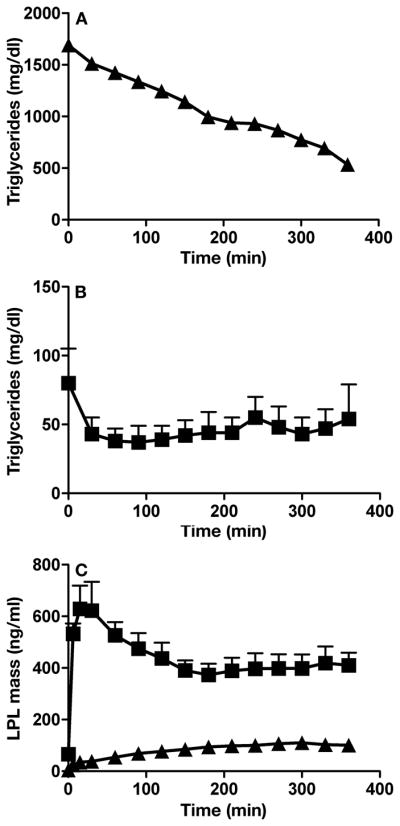
Figure 7. LPL mass and triglycerides in the plasma during a continuous infusion of heparin in the Q115P homozygote and controls.

We analyzed LPL mass and triglyceride levels in multiple samples taken every 30 min. (A) Plasma triglycerides in the Q115P homozygote. (B) Plasma triglycerides in normolipidemic control subjects. For the experiments shown in Panels A and B, an inhibitor of lipolysis, tetrahydrolipstatin, was added to the blood after they were collected. Thus, the fall in plasma triglycerides observed in Panel A could not be ascribed to continuing lipolysis occurring in the tube ex vivo. (C) Plasma LPL mass measurements in the normolipidemic controls and the Q115 P homozygote. Proband (▲); and controls (■). For the controls (n = 7), data are expressed as mean ± SEM.
