
Figure 4.
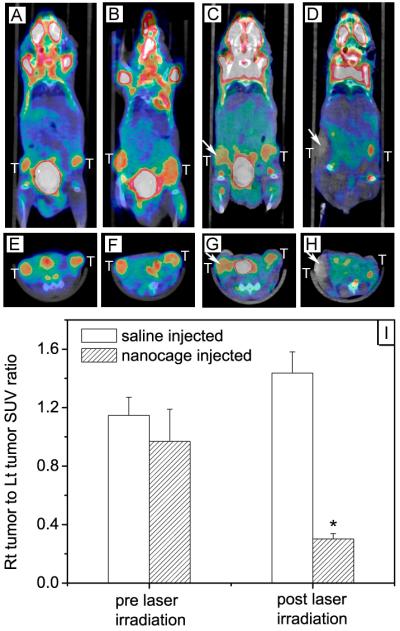
18F-FDG PET/CT co-registered images (coronal plane: A-D; axial plane: E-H) of mice injected with either gold nanocages or saline solution before and after laser irradiation: (A, E) a saline-injected mouse prior to laser irradiation; (B, F) a nanocage-injected mouse prior to laser irradiation; (C, G) the saline-injected mouse after laser irradiation; and (D, H) the nanocage-injected mouse after laser irradiation. The white arrows indicated the tumors that were exposed to the diode laser at a power density of 0.7 W/cm2 for 10 min. (I) Plot showing the ratios of laser-treated tumor to non-treated tumor for 18F-FDG standardized uptake values (SUV, P<0.001) [66], Copyright 2010 Wiley-VCH.