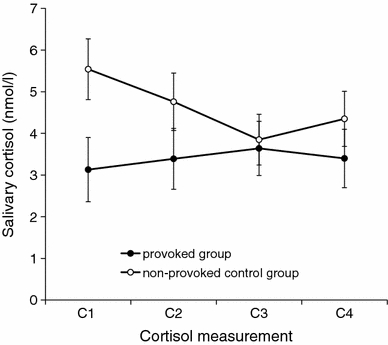
Fig. 3.

Cortisol levels during the experiment in the provoked group and the non-provoked control group. C1, baseline before induction of aggression; C2, shortly after induction of aggression; C3, about 20 min after induction of aggression; C4, at the end of the experiment, about 30 min after induction of aggression. Values are original means ± SEM
