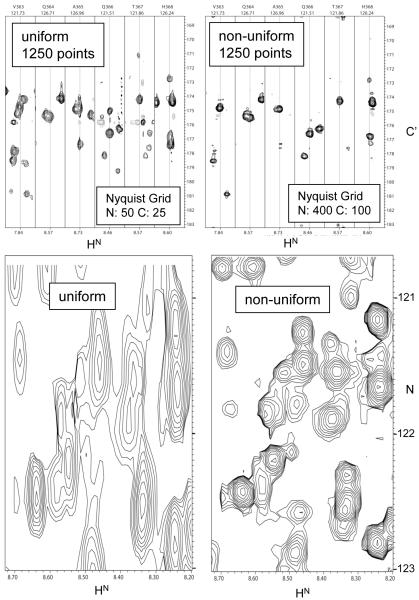
Figure 2.
Comparison of two 3D semi constant time HNCO spectra of the 48 kDa C domain of EntF recorded with US (left) and NUS (right). Sampling points were selected randomly with an exponentially decreasing sampling density to account for relaxation. Top: Representative 1H-13C’ strips. Bottom: representative sections of the H-N projections. For both spectra, a total of 1250 FIDs were recorded in the N-C Nyquist space, and thus the same measuring time was needed for both experiments. For the US spectrum, the first 50 and 25 grid points of the N-C Nyquist grid were populated, respectively; for the NUS spectrum, the 1250 recordings were randomly distributed over a much larger Nyquist grid spanned by 400 points in the nitrogen and 100 points in the carbon dimension. This represents population of only 3% of the 40,000 grid points. The NUS data were processed with the FM reconstruction procedure using 100 iterations minimizing the linear l1 norm. Processing was carried out on a share 128 core Xenon cluster within 14 days. The dramatic gain in resolution is obvious.

