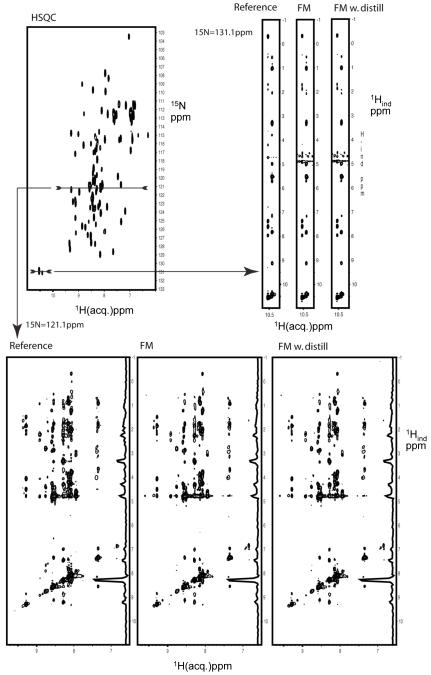
Fig. 6.
Comparison of sections of a NUS and FM reconstructed 3D 15N dispersed NOESY with the corresponding US experiment. Both spectra cover a Nyquist grid of 128 and 50 indirect time domain points in the indirect 1H and 15N dimensions, respectively. For the NUS data 2048 grid points (32%) were selected randomly, and the missing time-domain data were obtained with the FM reconstruction. The direct dimension was processed to 512 t3 data points prior to the FM reconstruction of the indirect dimensions. The US data were processed with regular FM and also with 7 iterations of distillation. All three data sets, the US, NUS-FM, and NUS-FM-distill time domain data were finally transformed identically with the DFT algorithm of the NMRPipe program. Top left: 1H-15N HSQC as a reference. Bottom: Comparison of the same cross plane from the US data, the NUS-FM reconstructed data, and the same NUS data reconstructed with the FM and distillation procedure. Top right: 1H-1H strips from the same three data sets. The positions where the cross planes are taken are indicated with arrows. The FM reconstruction of the NUS spectrum was obtained in 1.5 hrs on a 128 cpu Linux farm. The US and NUS spectra were recorded independently, the NUS spectrum was recorded in one third of the time.

