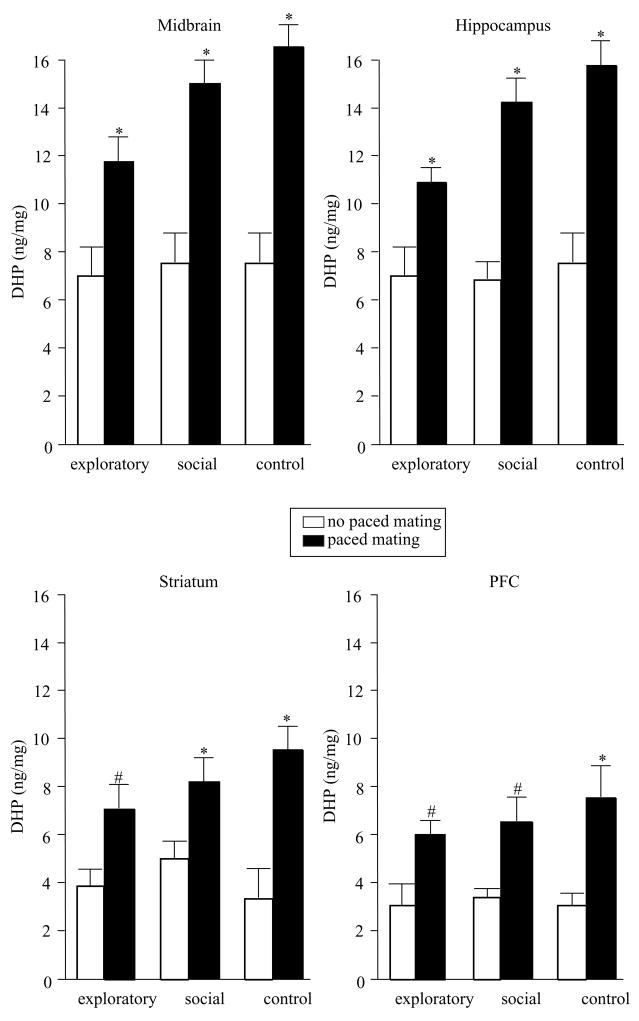
Figure 3.
Levels of DHP (± S.E.M.) in midbrain (top left), hippocampus (top right), striatum (bottom left), and cortex (bottom right) of rats tested in exploratory or social behaviors, or controls, alone (open bars) or in conjunction with paced mating (closed bars). Asterisk indicates significantly different from respective no paced mating control group (P < 0.05). # indicates (P≤0.10).

