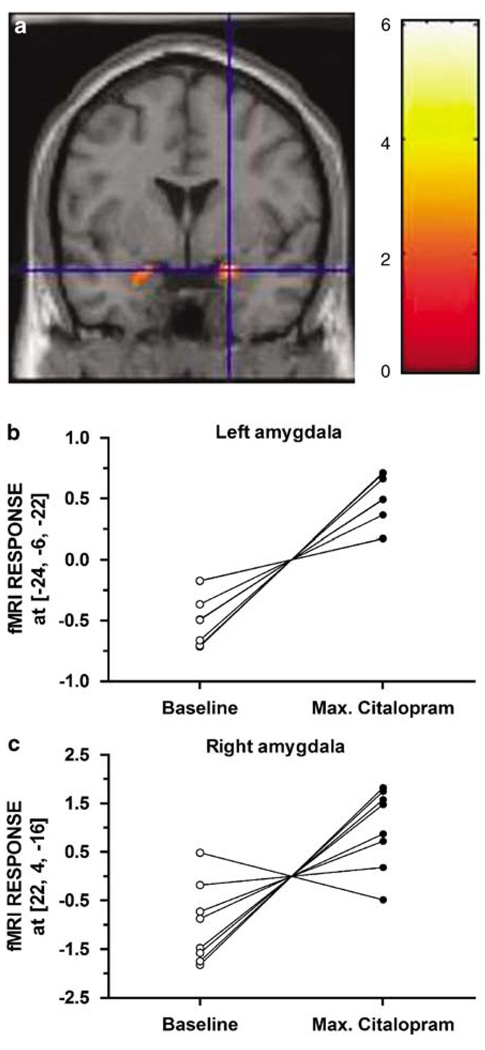
Figure 1.
(a) Amygdala clusters exhibiting greater activation as a function of acute citalopram, Left amygdala (−24, −6, −22) cluster size = 115 voxels, T = 6.05, p < 0.001; right amygdala (22, 4, −16) cluster size = 56 voxels, T = 3.39, p = 0.006. Individual fMRI responses at baseline and at end of citalopram infusion for left amygdala (b) and right amygdala (c).

