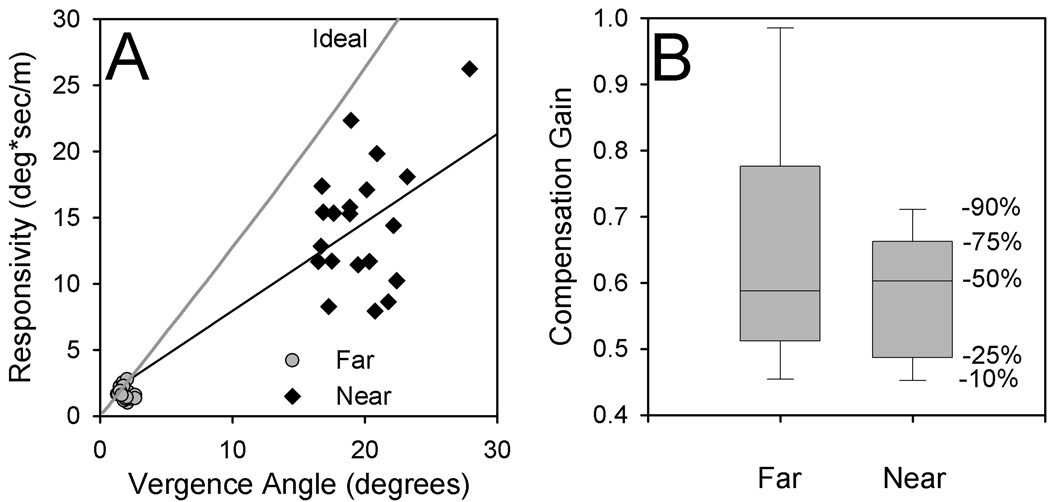
Figure 2.
Summary of tVOR responses to bob at 2.0 Hz of 20 normal subjects.6 (A) Responsivity plotted as a function of vergence angle. Note that during near viewing (diamonds, corresponding to larger vergence angles), responsivity increases substantially compared with far viewing (circles). (B) Box plots, showing percentiles for compensation gain values during far and near viewing; these were similar, despite the large changes of responsivity shown in (A).

