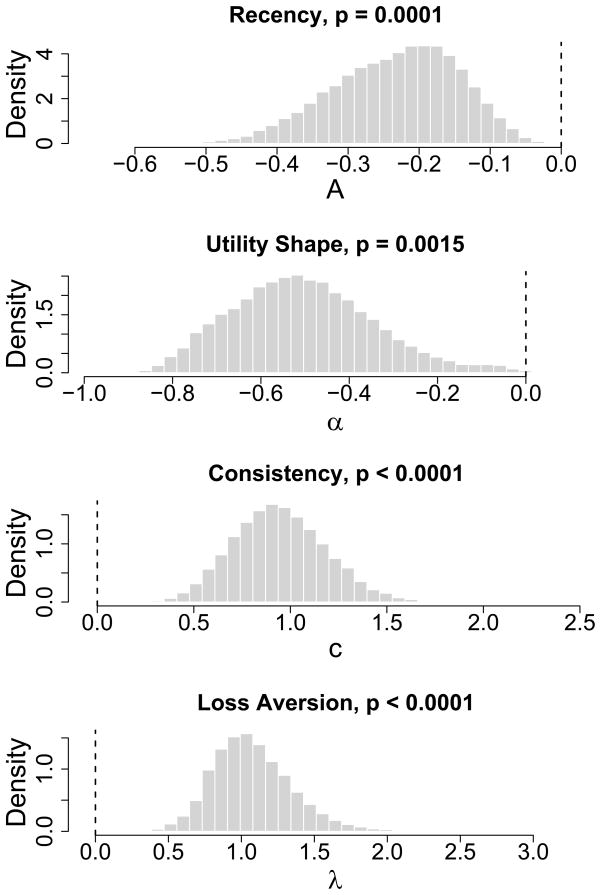
Figure A1.
Posterior distributions of differences of group mean parameters. Differences represent each mean parameter of the control group minus the corresponding parameter of the user group. Specifically, they are denoted by μA control − μA.user, μα.control − μα.user, μλ.control − μλ.user, and μc control − μc.user. Each of the parameters is the mean of the beta distribution that models individual differences in each PVL model parameter for the two groups.

