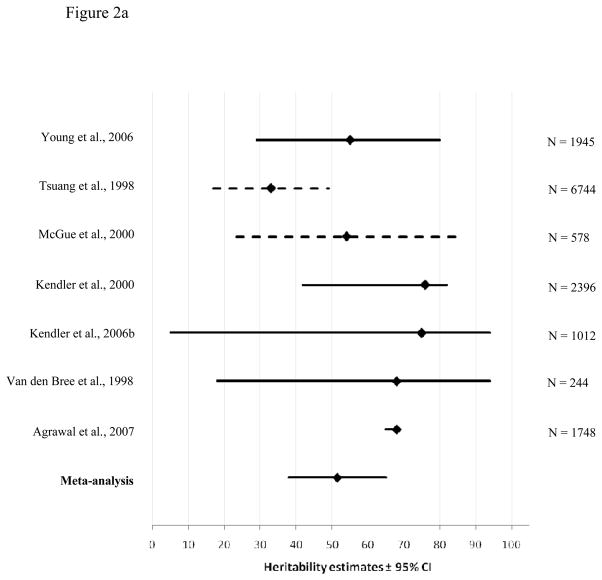
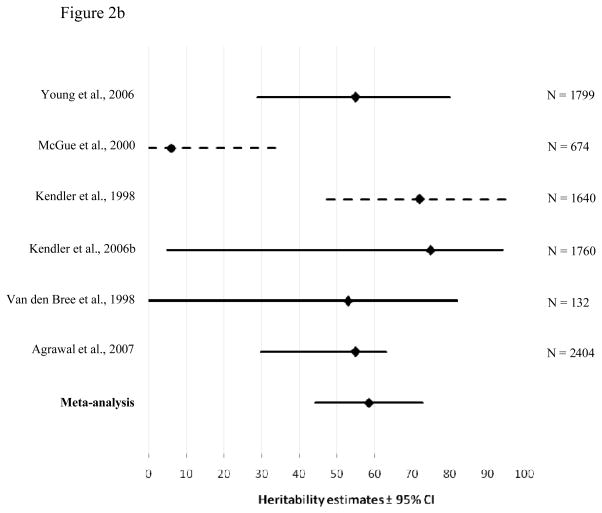
Figure 2.
Heritability estimates (i.e. proportion of variance accounted for by genetic influences (A)) and 95% confidence intervals for the studies used in the meta-analysis of problematic cannabis use for males (2a) and females (2b). The bottom line shows the weighted A estimate and 95% confidence intervals estimated in the present meta-analysis. Dotted lines show confidence intervals estimated by a logarithmic curve regression on the sample sizes.


