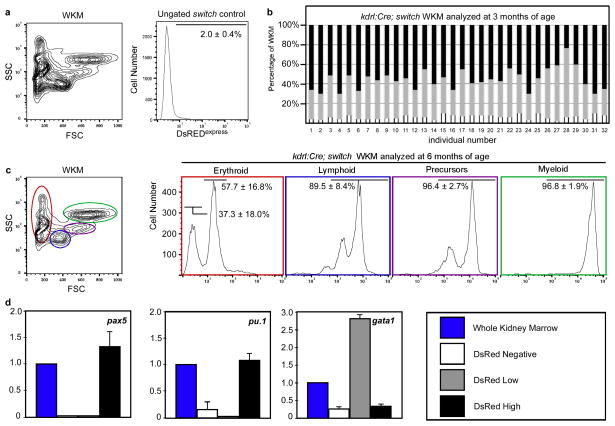
Figure 3. Long-term lineage tracing of embryonic endothelial cells.
a, Flow cytometric analysis of WKM from a transgenic βactin:switch adult animal. b, Bar graphs show the percentage of switched cells (DsRedhi shaded black; DsRedlo grey) in WKM of double transgenic kdrl:Cre; βactin:switch adult animals (n=32). DsRed− cells are represented in white. c, Histogram plots show percentages of switched hematopoietic lineages at 6 months of age in WKM (average ± standard deviation, n=5). d, Quantitative PCR expression of switched (DsRedhi in black; DsRedlo in grey) and non-switched cells (white bars) at 3 months, for B lymphoid (pax5), myeloid (pu.1) and erythroid (gata1) genes. Units on Y-axis represent fold changes from WKM, the reference standard set at 1.0. Error bars, standard deviation.

