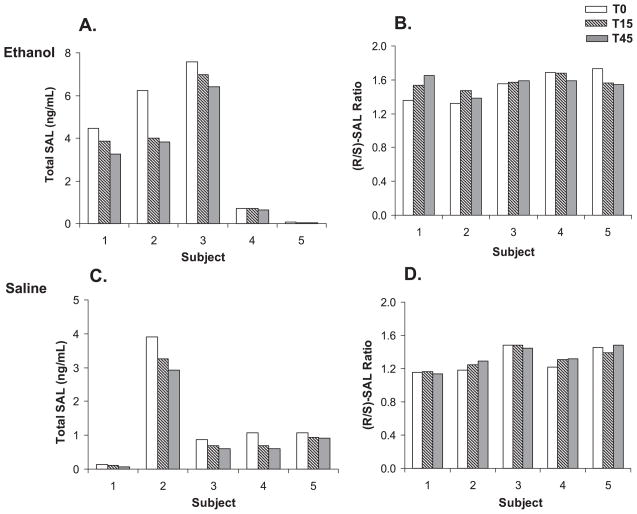
Fig. 2.
Effect of ethanol infusion on plasma SAL levels and enantiomeric distribution in nonalcoholic human subjects. Total SAL level (A) and R / S ratio (B) in plasma collected from volunteers during ethanol infusion (T = 0, 15, 45 minutes) are shown. Also shown are total SAL level (C) and R / S ratios (D) in plasma during saline infusion in the same subjects that participated in the ethanol infusion.

