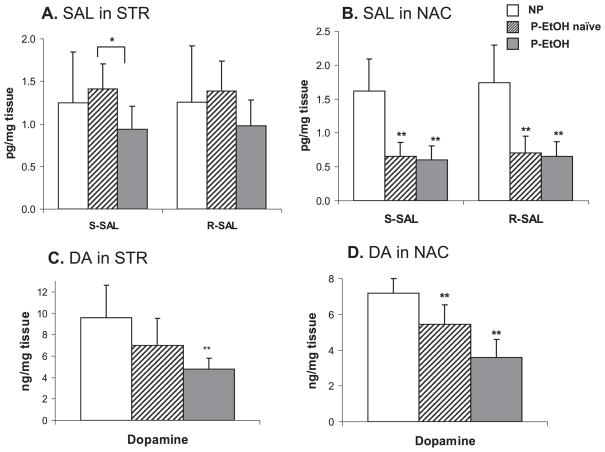
Fig. 5.
The levels of SAL and DA in the STR (A, C) and NAC (B, D) of NP, P-naïve, and P-EtOH rats. Values represent mean ± SD (n = 7 animals / group). Significantly lower SAL level was observed in NAC of P-rats in comparison to NP-rats. DA levels were also lower in both brain regions of P-rats. Free-choice ethanol drinking in P-rats did not increase SAL levels. Statistical significance was tested against NP rats. *p < 0.05; **p < 0.01.

