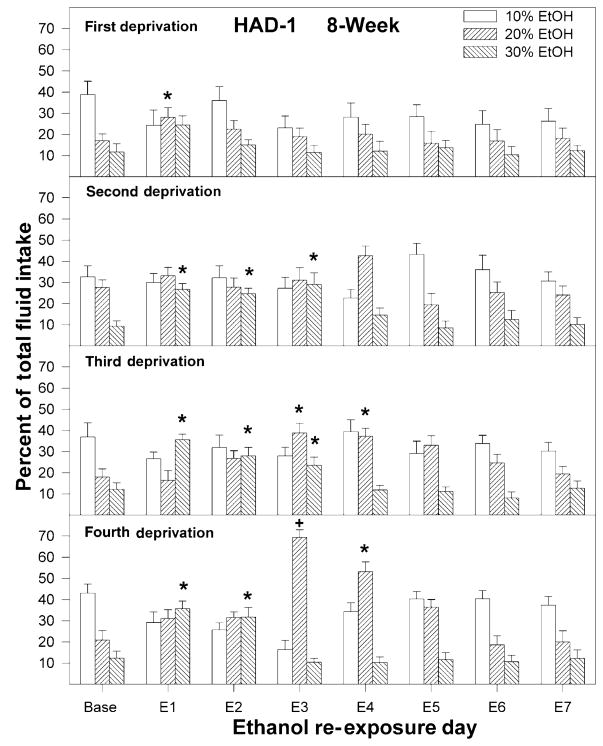
Figure 3.
Percent of total fluid intake consumed by high-alcohol-drinking-1 (HAD-1) rats of 10, 20 and 30% ethanol following each deprivation for the rats initially deprived of alcohol for 8 weeks. Baseline values were determined from the average of the last 3 days just before deprivation. An asterisk symbol (*) indicates that preference for that solution was increased compared to baseline levels. A pound (#) symbol indicates preference for that solution decreased compared to baseline values. A plus symbol (+) indicates that the preference for that solution was increased compared to baseline levels, and compared to preference following all other deprivation cycles on that re-exposure day

