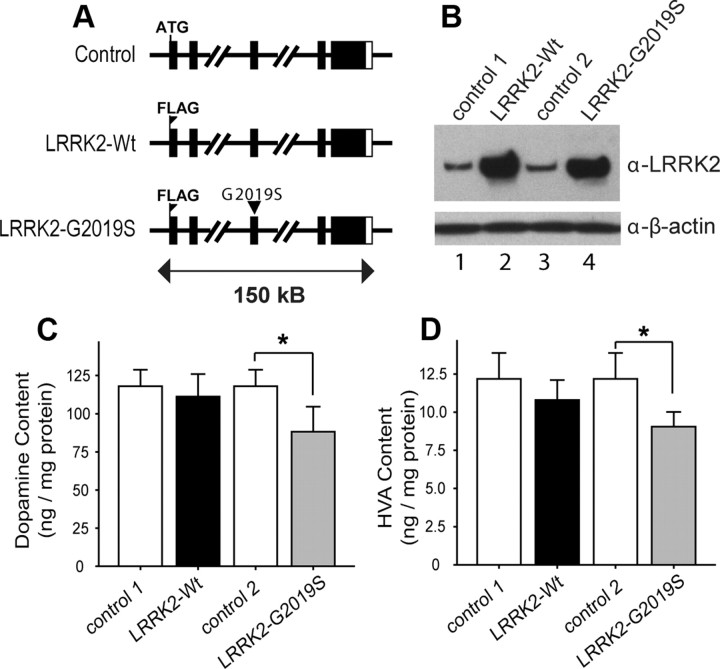
Figure 1.
BAC transgenic LRRK2-Wt and LRRK2–G2019S mouse lines: transgene levels and striatal DA content. A, Schematic showing the original BAC with the mouse LRRK2 gene, modified LRRK2-Wt BAC in which the FLAG tag was inserted in-frame after the ATG translation start codon, and LRRK2–G2019S BAC carrying G-to-S mutation at amino acid 2019. B, Western blot using anti-LRRK2 antibody shows that transgenes LRRK2-Wt and LRRK2–G2019S produce similar protein levels, approximately sixfold higher than endogenous brain LRRK2. C, D, HPLC analysis indicated that striatal DA and HVA contents were ∼25% lower in LRRK2–G2019S than in littermate control mice at 12 months (*p < 0.05 vs control 2, n = 7 mice per group). Striatal DA or HVA in LRRK2-Wt mice did not differ significantly from littermate controls (p > 0.05 vs control 1, n = 7 mice per group). Quantitative data are expressed as mean ± SEM and were analyzed by one-way ANOVA with Bonferroni's post hoc analysis.

