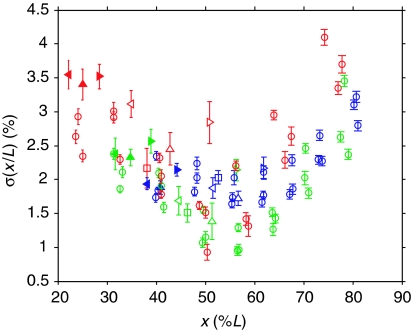
Figure 1.
Measuring precision of Bcd target genes. Measure of imprecision σ(x/L) of the gap and pair-rule gene expression domains as a function of position x along the AP axis (see Supplementary Dataset S1). Errors (bars) were estimated by computing the standard deviation across 50 independent (semi-automated) markings of expression domain boundaries. For Gt (filled triangles) and Kr (empty triangles), we show results for their left (◃) and right (▹) boundaries, as well as for the center (▵) of their expression domain. The Hb (□) domain is characterized by the boundary where its concentration drops and the Eve stripes (○) by the position at which their intensity is maximal. Color code: 1xbcd (red), 2xbcd=wild type (green), 4xbcd (blue).

