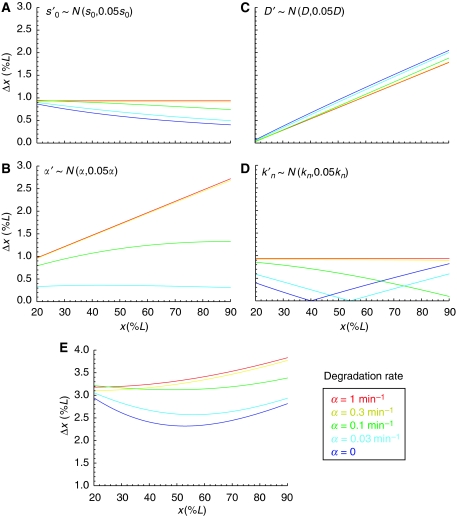
Figure 2.
Modeling precision of nuclear Bcd. Predicted positional variability at t=100 min for various Bcd degradation rates α={1, 0.3, 0.1, 0.03, 0} min−1 and their corresponding diffusion constants D={167, 55, 17, 5, 3} μm2/s, ensuring λ=0.2L at t=150 min (numerical fit); 5% noise was added to the Bcd profile at the level of (A) the production rate, (B) the diffusion constant, (C) the degradation rate and (D) the nuclear trapping rate. In (E), a combination of noise was added to the Bcd profile (17% on the production- and 6% on the diffusion rates; all contributions are assumed to be independent). (L=1 for all embryos.)

