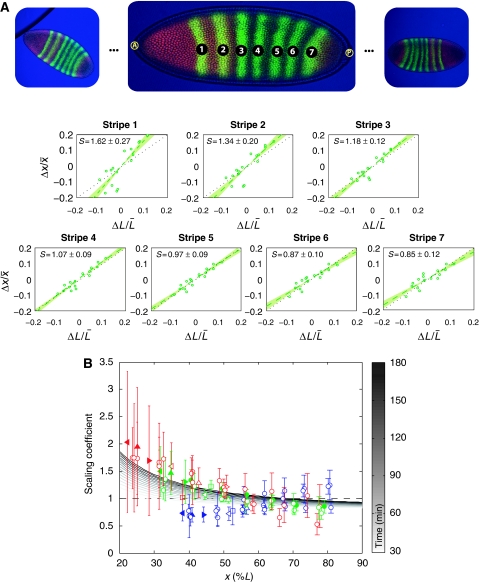
Figure 3.
Measuring scaling of Bcd target genes. (A) Scaling of the Eve stripes for wild-type bcd mRNA dosage, co-stained with Hb. For each stripe in each embryo (images on top), fluctuations in the domain position Δx/x̄ are plotted against fluctuations in embryo size ΔL/L̄. Scaling coefficients are then estimated by linear regression. Errors show 68% confidence intervals from the regression analysis. (B) Measured scaling coefficients of the gap and pair-rule gene expression domains as a function of position x along the AP axis (see Supplementary Dataset S2). Errors (bars) represent 68% confidence intervals from the linear regression. For Gt (filled triangles) and Kr (empty triangles), we show results for their left (◃) and right (▹) boundaries, as well as for the center (▵) of their expression domain. The Hb (□) domain is characterized by the boundary where its concentration drops and the Eve stripes (○) by the position at which their intensity is maximal (filled circles represent Eve co-stained with Hb, as in (A)). Color code: 1xbcd (red), 2xbcd=wild type (green), 4xbcd (blue). We also show scaling as predicted by our model (grayscale). Parameters are chosen such that the profile is closest to an exponential decay with length scale λ=0.2L at t=150 min (see Supplementary Figure S12 for temporal evolution).

