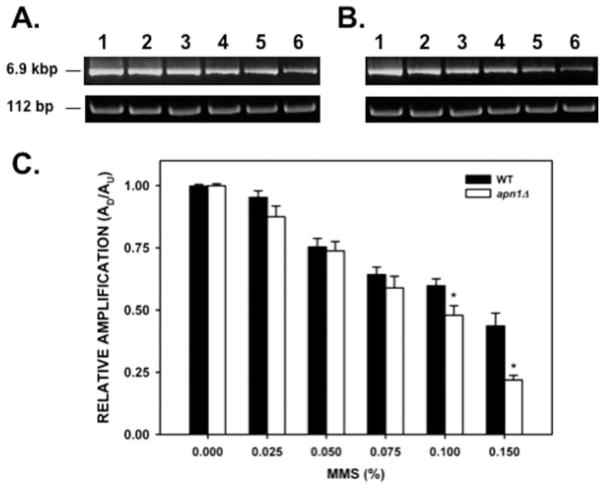
Fig. 1.
Mitochondrial DNA damage induced by MMS. Yeast cells (A, wild type; B, apn1Δ mutant) were treated with increasing concentrations of MMS for 20 min, followed by DNA isolation. QPCR analysis was performed as described in the “Materials and Methods” section. (A, B) Representative gel electrophoresis indicating the expected sizes of the large (6.9 kb) and small (112 bp) mitochondrial DNA fragments. Lanes 1–6: PCR products from yeast cells treated with 0, 0.025, 0.05, 0.075, 0.1, 0.15% MMS, respectively. (C) Relative levels of amplification of the 6.9-kb mitochondrial fragment after normalization with the small mtDNA fragment (n = 3 independent experiments performed in triplicate). Asterisks (*) denote statistical significance (P < 0.05). Error bars represent SEM.

