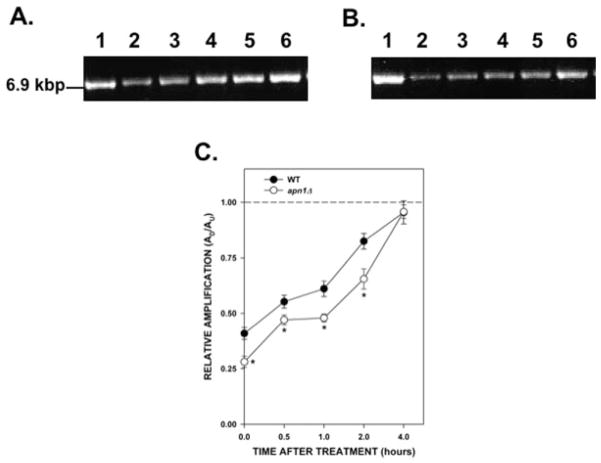
Fig. 6.
Kinetics of repair of nDNA damage induced by MMS. Yeast cells were treated with 0.1% MMS for 20 min. Cells were washed with water, resuspended in fresh YPD media, and incubated for up to 4 hr at 30°C. Aliquots of cells were removed at the indicated times. DNA isolation and QPCR were performed as described. (A) Wild type; (B) apn1Δ mutant. (A, B) Representative gel electrophoresis indicating the expected sizes of the nDNA fragments. Lane 1: PCR products from untreated yeast cells; lanes 2–6: PCR products from yeast cells after 0, 0.5, 1, 2, and 4 hr after MMS, respectively. (C) Relative levels of amplification of the 6.9-kb nDNA fragment. The dashed line represents the amplification of untreated cells, which was set to a value of 1.0. Results are from two independent experiments with each PCR performed in triplicate. Asterisks (*) denote statistical significance (P < 0.05) between WT (closed circles) and apn1Δ cells (open circles). Error bars represent SEM.

