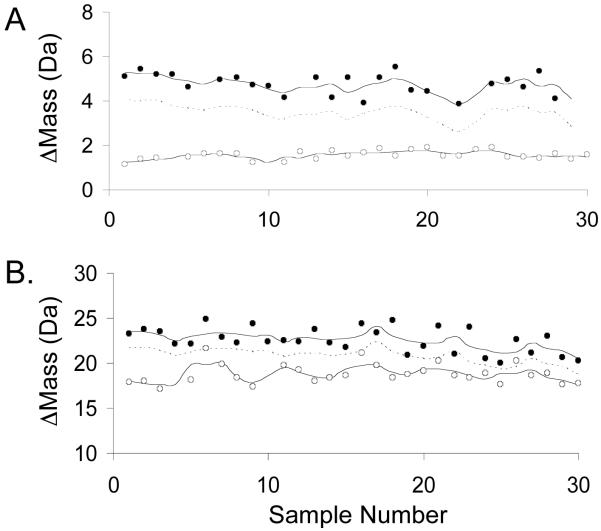
Figure 3.
Control screening data obtained for two CypA peptides with different Z’-factors. A) Data obtained using fragment 2 with a Z’-factor of 0.4. B) Data obtained using fragment 10 with a Z’-factor of -0.9. In each panel the data obtained on the negative and positive controls are represented with filled and open circles, respectively. The upper and lower solid lines represent the Δmassav of the negative and positive controls, respectively, and the dashed line represents the cutoff values, which are three standard deviations below the negative control Δmassav values.

