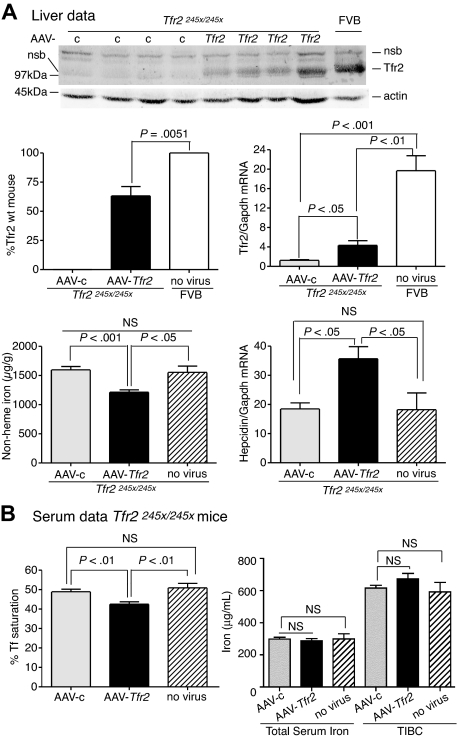
Figure 2.
Liver-specific expression of Tfr2 lowers iron levels, increases hepcidin expression, and lowers Tf saturation in Tfr2245x/245x mice. (A-B) A similar protocol was used as outlined in Figure 1, except mice were injected with 2 × 10¹¹ genome equivalents per mouse of AAV-Tfr2. In this case AAV-Tfr2 virus was injected into mice lacking functional Tfr2. The highest and lowest bands on the TfR2 immunoblot are nonspecific bands (nsb). Similar measurements were made as in Figure 1; ■ represent AAV-Tfr2 virus injected into Tfr2245x/245x mice; ▩, AAV-c virus injected into Tfr2245x/245x mice;  , uninjected Tfr2245x/245x mice; □, strain-, age-, and sex-matched wild-type mice. All mice were on a FVB/NJ (FVB) background. Four mice were used in each set of measurements. The experiment was repeated once with similar results. Error bars represent SD.

