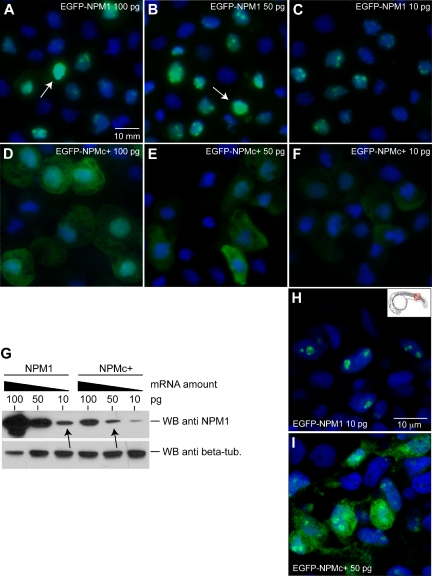
Figure 3.
Mutated human NPM1 is aberrantly expressed in the cytoplasm of zebrafish cells. (A-F) Epifluorescence analysis of EGFP-NPM1 (A-C) and EGFP-NPMc+ (D-F) subcellular localization in cytospins of zebrafish cells after mRNA injection at the indicated amounts. NPM1 or NPMc+ proteins are shown in green, and nuclei are counterstained in blue with DAPI. Cells were visualized with a Zeiss Axio imager Z1 microscope using a Zeiss 63×/1.4 numeric aperture (NA) Apochromat oil lens (Carl Zeiss). Images were acquired with Openlab software (Perkin Elmer). (G) WB analysis of protein extracts from NPM1 (top left 3 lanes) and NPMc+ (top right 3 lanes) mRNA-injected embryos. NPM1 expression levels at each mRNA dose are shown along with β-tubulin expression as a loading control (bottom row). The arrows indicate the doses used for subsequent experiments. (H-I) Confocal microscopy of EGFP-NPM1 subcellular localization in zebrafish embryos at 24 hpf injected with 10 pg of EGFP-NPM1 mRNA (H) and 50 pg EGFP-NPMc+ mRNA (I). NPM1 protein is shown in green, while nuclei are counterstained in blue with DAPI. Images of cells were taken in the dorsal trunk region, shown in the insert (H), with a Zeiss LSM 510 META 2-Photon confocal microscope (Carl Zeiss), using a Zeiss 63×/1.4 NA Apochromat oil lens (Carl Zeiss). Images were acquired with the Zeiss LSM 510 software (Carl Zeiss). The EGFP expression patterns shown were representative of cells throughout the embryo.

