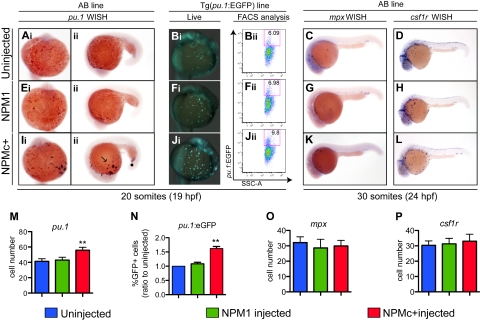
Figure 5.
NPMc+ increases the number of primitive myeloid cells in zebrafish embryos. (Ai-Aii,Ei-Eii,Ii-Iii,M) WISH assays of AB embryos showing pu.1 expression at 20 somites (19 hpf) in ventral views, anterior to the top (A,E,Ii), and lateral views anterior to the left, dorsal upwards (Aii,Eii,Iii). pu.1-expressing cells are shown as dark purple dots that increase in number with NPMc+ expression (Ii-Iii). (M) pu.1+ cell number quantification shows a statistically significant increase upon NPMc+ expression (20 embryos counted per condition). (B,F,J) pu.1 expression analysis in the Tg(pu.1:EGFP) line at 20 somites (19 hpf). Ventral views, anterior to the top, of the ALPM and yolk of live Tg(pu.1:EGFP) transgenic zebrafish embryos, uninjected (Bi), or injected with NPM1 10 pg (Fi) or NPMc+ 50 pg (Ji) mRNA. Green cells indicate cells expressing EGFP under the control of the pu.1 promoter. NPMc+ expression causes a marked increase in EGFP+ cell numbers that disperse widely across the embryo's yolk (Ji). FACS analysis of Tg(pu.1:EGFP) embryos, uninjected (Bii), or injected with NPM1 10 pg (Fii) or NPMc+ 50 pg (Jii) mRNA. EGFP expression is shown in the y-axis and is increased upon NPMc+ expression (Jii). (N) Quantification of the percentage of EGFP+ cells in 3 independent FACS experiments, each including 50 heterozygous Tg(pu.1:EGFP) embryos per condition, normalized to the percentage of EGFP+ cells of uninjected embryos. (C-D, G-H, K-L, O-P) WISH assays showing lateral views (anterior to the left, dorsal upwards) of 30 somites (24 hpf) embryos stained for mpx (C,G,K) or csf1r expression (D,H,L). No significant change in expression of any of these markers is observed. The number of mpx and csf1r cells is quantified in panels O and P, respectively (20 embryos counted per condition). Note that the csf1r probe also stains xanthophores in the dorsal trunk of the embryo. In all graphs, error bars represent SEM. *Statistically significant differences between the NPMc+-injected and both NPM1-injected and uninjected embryos (**P < .005; Student t test). In histograms, blue indicates uninjected control embryos; green, NPM1-injected embryos; and red, NPMc+-injected embryos.

