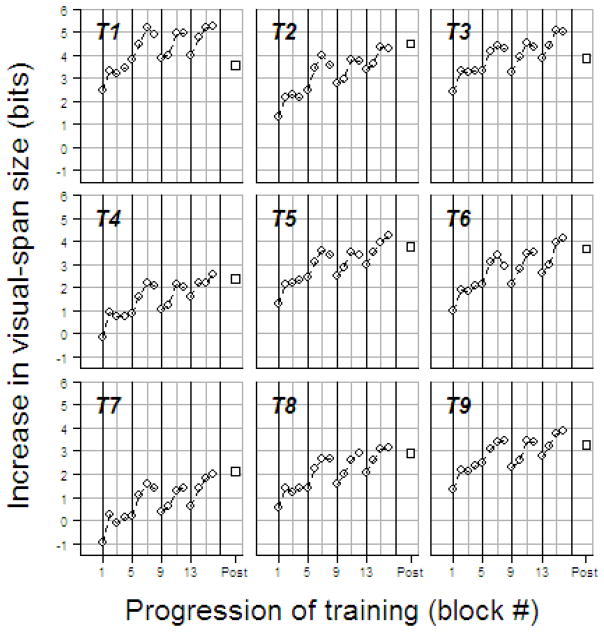
Figure 5.
Block-by-block changes in visual-span size (bits of information transmitted) during four days of training. Each panel shows data for one trained subject. Each open circle represents the increase in the visual-span size compared with pre-test values, based on a block of 220 trigram trials. Post-test changes in visual-span size, compared with the pre-test values, are plotted as open squares. The dark vertical grid lines indicate the transitions between training days.

