
FIG. 6.
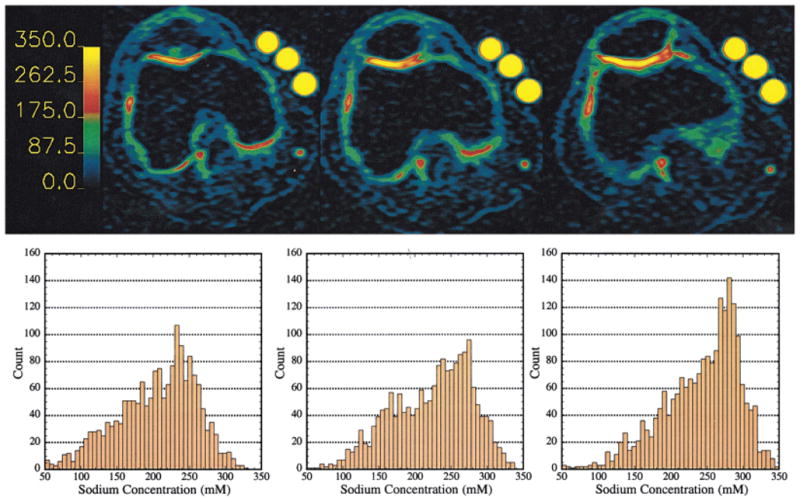
Sodium concentration maps from three slices from a 3D data set. The barscale is in millimolar sodium. Histograms correspond to the map above it, and contain only the pixels from the cartilage on or near the patella. Left: image displaying cartilage mainly from the femoral chondyle. The mean [Na] was 223 mM, FCD = −135 mM. Center: patellar cartilage, mean [Na] was 240 mM, FCD = −158 mM. Right: patellar cartilage, mean [Na] was 258 mM, FCD −182 mM. The signal intensity of the phantoms is maximized due to the thresholding of the maps.