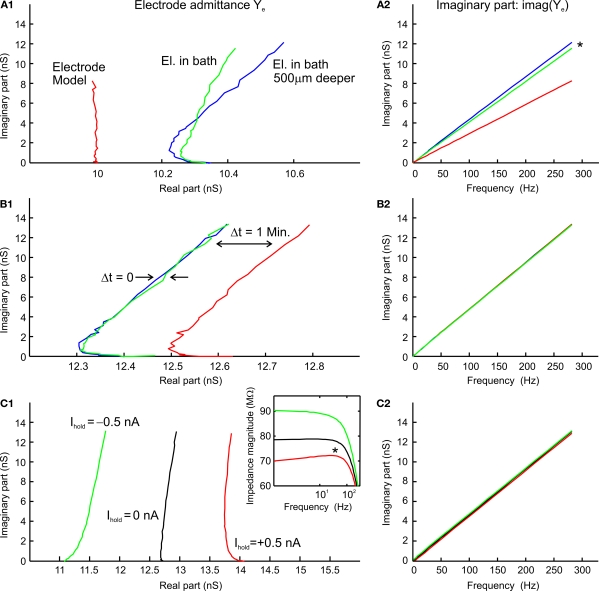
Figure 2.
Multi-sine analysis of electrode properties with discrete frequencies plotted for the range from 0. 2–300 Hz. (A1,A2) Admittance plots (A1) of the electrode model circuit with constant parallel capacitance and resistance (red line); admittance plots (A1) of KCl (3 M) filled electrode with the tip at 1.5 mm (green line) and 2 mm below the surface of the Ringer solution (blue line) show frequency-dependent changes of electrode properties influenced by the depth in the Ringer solution; plots of the imaginary part (A2) show that the electrode capacitance increases with increasing depth of the electrode tip in the bath (*); Ihold = 0 nA. (B1,B2) Admittance plots (B1) of three measurements of electrode properties in the recording chamber; measurements 1 and 2 were consecutive (green and blue lines), whereas the measurement 3 (red line) was taken 1 min later; note that the admittance fluctuates over time while the capacitance (B2) remains stable; Ihold = 0 nA. (C1,C2) Admittance plots (C1) of three electrode measurements with different holding currents Ihold = 0 nA (black line), −0.5 nA (green line), +0.5 nA (red line); injection of a constant current changes the real part of the electrode admittance response while the capacitance (C2) remains unchanged.

