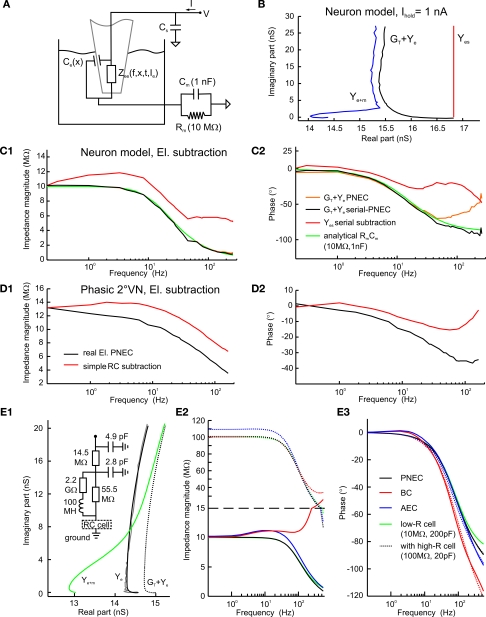
Figure 3.
Model test of the Piece-wise Non-linear Electrode Compensation (PNEC) method. (A) Equivalent circuit diagram of the test setup with the electrode in the Ringer-filled recording chamber representing a parallel impedance Zee(f, x, t, Ie) and a capacitance, Ce(x), serial to a passive neuronal circuit model (Rm = 10 MΩ, Cm = 1 nF) attached to the electrical path-to-ground and a constant amplifier stray capacitance, Cs, parallel to the model. (B) Admittance plots of the corrected electrode alone GT + Ye (black line) of the electrode with an attached neuronal circuit model Ye + m (blue line) and the analytical response of a simple RC-type electrode model Yes (red line); Ihold = +1 nA, plotted frequency spectrum 0.2–485 Hz. (C1,C2) Bode plots of a passive neuronal circuit model using different electrode compensation methods on the combined measurement Ye + m: (a) electrode GT + Ye (orange lines) with PNEC, (b) electrode GT + Ye using serial-PNEC (black lines), (c) simple theoretical RC electrode, Yes, using serial subtraction (red lines) and (d) the analytical passive neuronal circuit model (green lines). Note that using the simple RC electrode compensation for the passive neuronal model shows a resonance that is solely an electrode compensation artifact; trace labels in (C2) also apply to (C1). (D1,D2) Results from the subtraction of a simple RC-type electrode (red lines) and using PNEC with the actual electrode (black lines) on the intracellular records of a phasic 2°VN; note that subtraction of a simple RC-type electrode also shows an incorrect resonance for the actual neuron that is caused by the above electrode artifact; trace labels in (D1) apply also to (D2). (E1) Time-domain simulation of PNEC, AEC and BC; admittance plots of an electrode with distributed capacities and parallel resistance and inductance (inset) Ye (black line) with parameters adjusted to mimic the behavior as measured in real electrodes (gray line), with an attached passive RC neuronal circuit model (10 MΩ, 200 pF) and reduced overall resistance Ye + m (green line) and shifted electrode GT + Ye + m (dotted line) prior to PNEC subtraction; plotted frequency spectrum 0–556.2 Hz. (E2,E3) Results after electrode compensation with a low resistance RC cell (low-R: 10 MΩ, 200 pF) (solid lines) or a high resistance RC cell (high-R: 100 MΩ, 20 pF) (dotted lines): simple BC (red) or AEC compensation (blue) causes electrode resonance artifacts in the impedance (E2) and phase (E3), while PNEC (black) complies well with the expected results (green); change of y-coordinate scale at 15 MΩ (dashed line) in (E2); trace labels in (E3) also apply to (E2).

