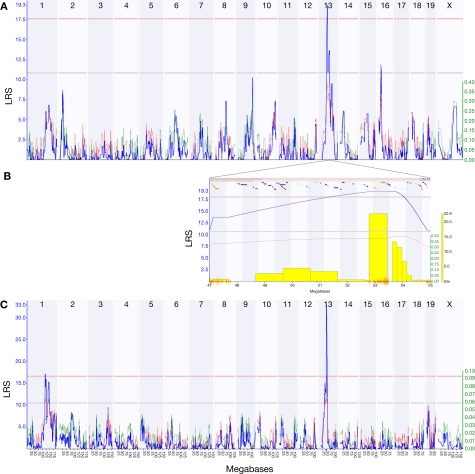
Figure 2.
The HipVol1a QTL identified by interval mapping the Published Phenotypes trait 10460 (dentate gyrus volume) against dense genotype data for 69 BXD strains. Plots show interval maps for the whole genome (A) and the HipVol1a region on chromosome 13 at 47–55 Mb (B). The candidate gene Tpmt (1419121_at) has a strong cis-QTL at the same locus as HipVol1a (C). Blue lines show the likelihood ratio statistic (LRS) and secondary lines indicate whether C57BL/6J (red) or DBA/2J (green) alleles increase trait values. Yellow bars in (B) indicate results of a bootstrap analysis and orange lines show SNP density.

