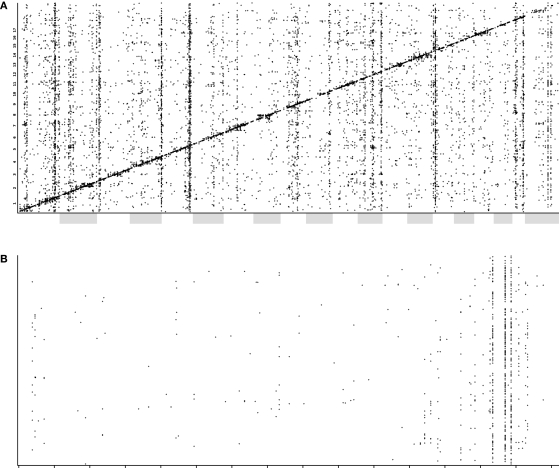
Figure 4.
(A) A plot of QTLs from transcript expression phenotypes. The x-axis shows the global genomic position of the associated marker (chromosomes are alternately shaded) and the y-axis shows the position of the gene encoding the transcript. (B) A QTL plot, as above, for chromosome 5 only. Here, cis-QTLs (QTL position within 10 Mb of gene position) have been removed for clarity. The Trans5A trans-band can be clearly seen localized to three adjacent markers.

