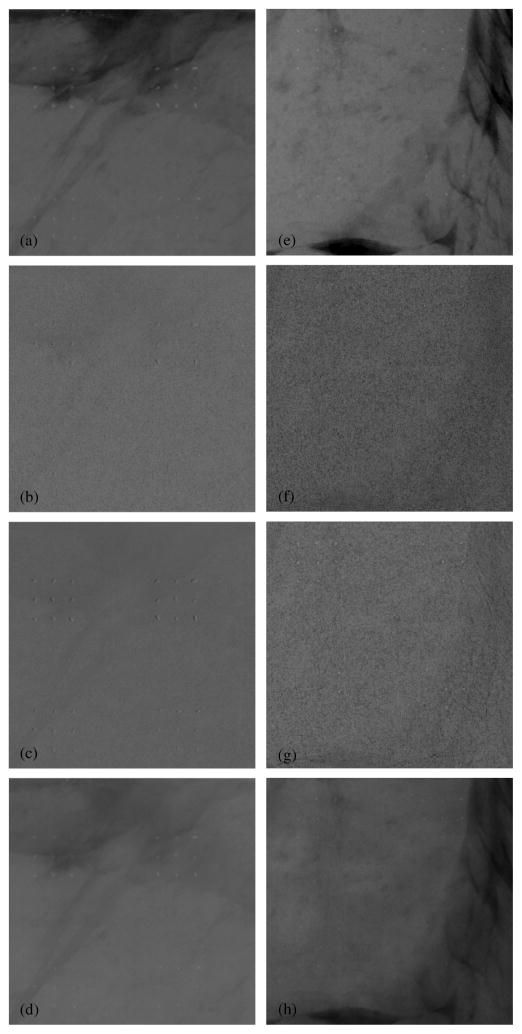
Figure 10.
Images from two 5 × 5 cm sections of the tissue calcification phantom. The images on the left (a–d) are from one section of the phantom with calcification sizes of 355–425 (top) and 300–355 (bottom) μm, while images from the right (e–h) are from another section of the phantom with calcification sizes of 280–300 (top) and 250–280 (bottom) μm. The top row (a and e) shows the conventional single-energy images (LE-1R). For each phantom section, three DE images are shown: the second row (b and f) shows the standard DE calcification images without any noise reduction (DE-STD), the third row (c and g) shows the DE calcification images with the HE median filter technique (DE-HEMF-3), and the last row (d and h) shows the DE calcification images with the KNR technique (DE-KNR-S-51).

