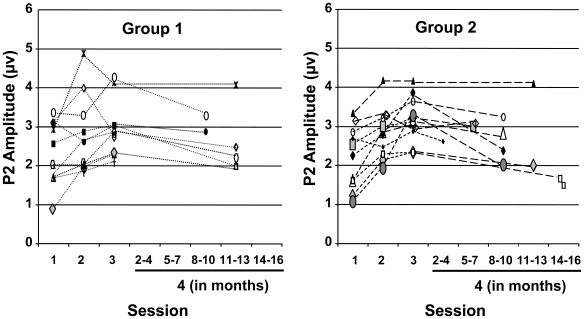
Figure 6. Retention Data.
Individual P2 peak amplitude data are shown for all four Sessions in response to the stimulus “mba”. Results shown are from electrode site TP9. When looking at individual subjects, enhanced P2 amplitudes can be seen for many individuals (in Group 2) even though they had not heard these sounds for many months.

