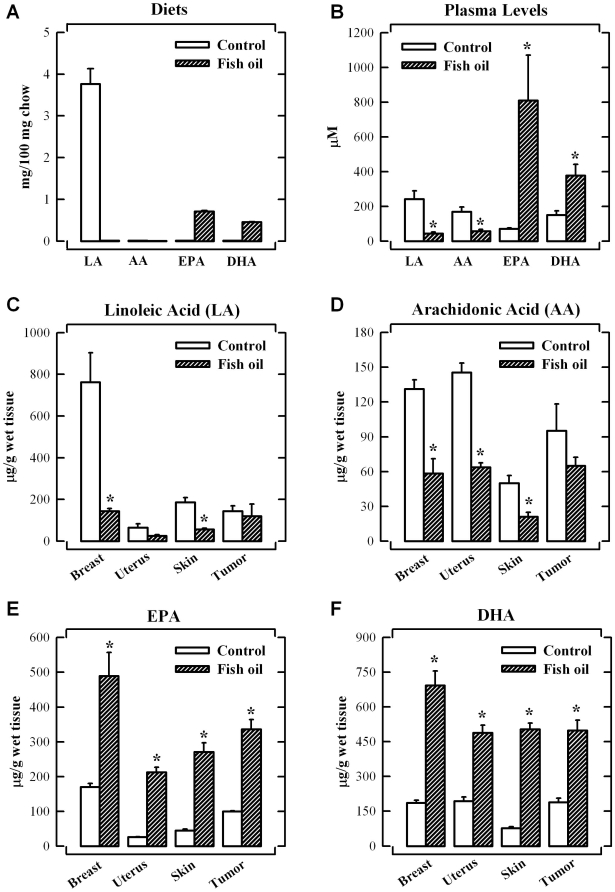
Figure 6. Omega-3 fatty acid levels in diets, plasma and tissues.
Concentrations of FAs in food (A) and plasma (B). Comparison of the concentrations of LA (C), AA (D), EPA (E) and DHA (F) in various tissues. Nude mice were maintained on control or fish oil diet for 6 weeks after the subcutaneous implantation of MCF-7 cells (5×10⁶ cells in 100 µL PBS). Each value is the mean ± S.D. (n = 5). * P<0.05 vs. the control diet group.

