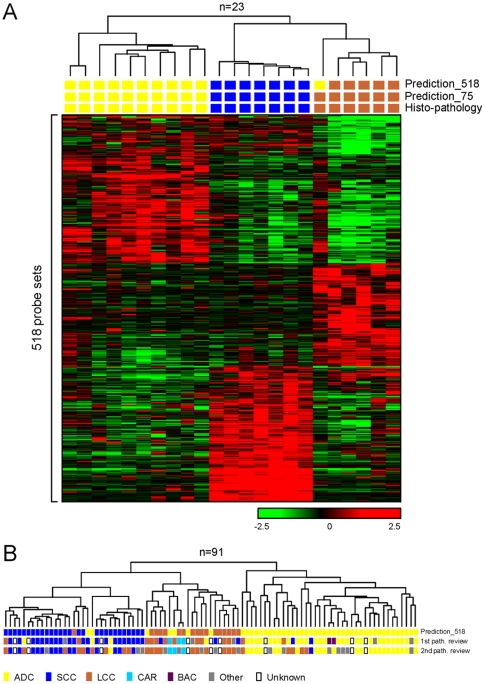
Figure 3. Clustering analysis of NSCLC tumors with the 518 probe set histology signature.
A: agglomerative hierarchical clustering of 23 NSCLC samples using the 518 probe set histology signature. The relative expression to the overall mean for each probe set (rows) in each sample (columns) is indicated by a color code. Correlation between the samples is depicted by the dendrogram. Histo-pathological diagnosis and predictions of histology subtype by Prediction Analysis of Microarrays, using the 518 and 75 probe set signatures, are shown by colored blocks. B: correlation dendrogram generated by agglomerative hierarchical clustering of all 91 Erasmus MC NSCLC samples using the 518 probe set signature. Histo-pathological diagnosis of the initial and second review, and prediction of histology subtype by Prediction Analysis of Microarrays using the 518 probe set signature, are shown by colored blocks.

