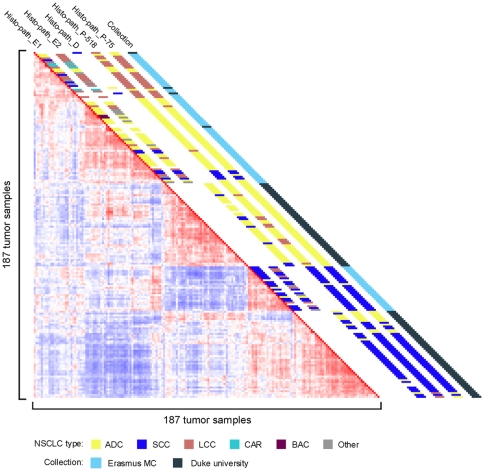
Figure 7. Correlation view of Erasmus MC and Duke University NSCLC samples.
In total 187 tumor samples from the Erasmus MC (n = 91) and Duke University (n = 96) cohorts are shown. Pairwise correlations between any two samples are displayed, based on 3495 informative probe sets. Histological classification of the samples, and the collection source, are depicted along the diagonal. The key to the color code is shown at the bottom. Histo-path_E1 & Histo-path_E2: initial and second histo-pathological review of Erasmus MC samples. Histo-path_D: histo-pathological review of Duke University samples; Histo-path_P-518 and Histo-path_P-75: predictions by PAM of histological subtypes using the 518 and 75 probe set signatures, respectively (see Tables S4 and S5).

