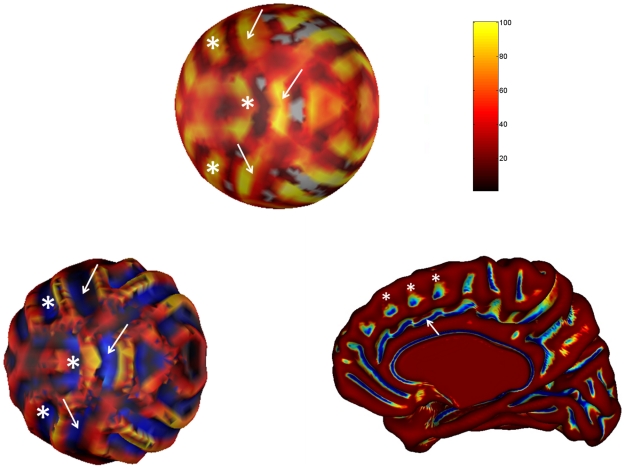
Figure 5. Reproducibility of the model compared to real data.
Top: Sum of the thresholded maps  converted in percentage. Areas of higher percentage (yellow) correspond to domains of high reproducibility of the folding patterns. The white arrows indicate the three parts of the main fold. Bottom left: Average surface of 50 simulations taken at time t = 4000 and the corresponding curvature in color. The white arrows indicate the three parts of the main fold. Bottom right: Average cortical surface of 222 hemispheres taken from experimental data. The white arrow indicates the cingulate sulcus while the four white arrows show secondary folds (paracingulate sulcus). In these three figures the white stars indicate the position of secondary folds.

