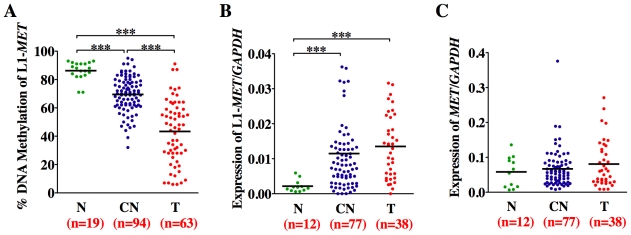
Figure 5. Methylation and expression status of L1-MET correlates in bladder tissues.
Horizontal lines represent the mean and n the number of patient samples. (A) Methylation status was analyzed by Ms-SNuPE in normal tissues (N, green), corresponding normal tissues (CN, dark blue), and bladder tumors (T, red). Values are an average of two CpG sites. (B) Expression of the alternate transcript from L1-MET and (C) the host gene MET, and the control gene GAPDH was measured by real-time RT–PCR. *** represents p<0.001, ** represents p<0.01, and * represents p<0.05 as determined by the Mann-Whitney test. While there are no error bars for the clinical sample analysis due to the extremely limited amount of sample DNA, the results show a consistent trend.

